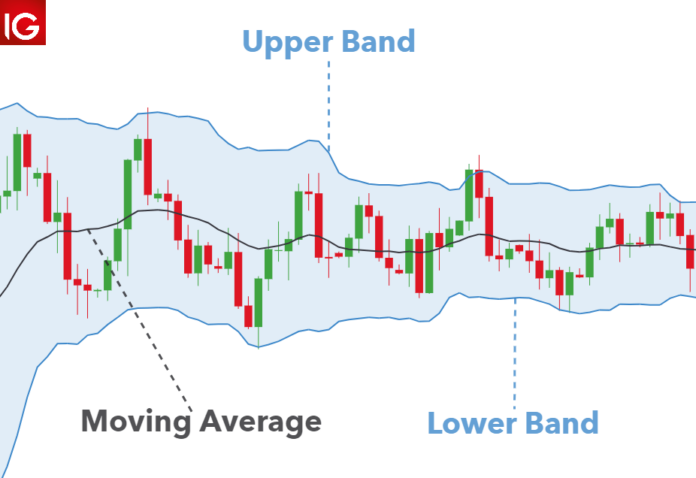
Bollinger Band is a popular technical analysis indicator for stock, crypto, forex trading created by John Bollinger in the 1980s.
The bands are a volatility indicator that monitors the price of a security’s relative highs and lows compared to previous trades.
Standard deviation is used to quantify volatility, and it fluctuates when volatility rises or falls.
When there is a price increase, the bands broaden, and when there is a price fall, the bands shrink. This tool can be used to trade a variety of assets due to its dynamic nature.
Bollinger Bands are typically made up of three lines: Upper, middle, and lower band. The center or middle band is a moving average, and the trader determines its parameters.
The upper and lower bands are on either side of the moving average band. The trader determines how many standard deviations the volatility indicator should be set at.
The number of standard deviations shows the distance between the middle band, the upper and lower bands.
The location of these bands indicates the strength of the trend as well as the possible high and low price levels to be predicted in the near future.
After covering the topic – What is Bollinger Bands, it’s time to jump onto the next one.
Are Bollinger Bands Accurate?
Bollinger bands are often regarded as a reliable indicator of market volatility. If the bands are wider, the market is more volatile; if the bands are narrower, the market is more stable.
Traders often look for Bollinger bands’ squeeze and bounces, which are indications for support and resistance levels.
Bollinger Bands squeeze, which occurs when the upper and lower bands compress toward the moving average, may indicate that the asset’s price is poised to break out.
On the other hand, bounces might signal an impending pullback if the price movement approaches the upper band and bounces back down.
However, the Bollinger bands indicator isn’t always 100 percent correct. Therefore, they should be combined with other types of analysis to get the most out of the data they provide.
Pros and Cons of Using Bollinger Bands:
Bolinger band is a technical analysis tool that is favored by seasoned traders most because of its features.
However, there are some drawbacks of using this tool, which can’t be ignored. So, here’s a list of some advantages and disadvantages of Bollinger Bands.
Advantages of using Bollinger Bands:
- A good indicator of analyzing market movements
- Traders can easily track strong trends, which causes volatility
- Bollinger bands are particularly user-friendly
- It offers another dimension to chart analysis for a trader
Disadvantages of using Bollinger Bands:
- It’s a lagging indicator that follows current market movements rather than predicting price trends.
- Traders may not get alerts until after the market movement has already begun.
- It should be combined with other types of technical analysis.
- It is not fool-proof or fail-safe market trend indicators.
What are Bollinger Bands Squeeze and Bounce?
Squeezes and bounces are the two main strategies to look for while performing Bollinger Band analysis.
Squeeze Strategy:
When volatility falls to low levels, the upper and lower bands of the Bollinger Bands shrink or “tighten.” The market is beginning a rotating period in this situation.
Therefore participation will be limited, and price activity will be turbulent. Traders typically use rotational trading methods in order to profit from a Bollinger Band squeeze.
One sells from the higher Bollinger Band and buys from the lower Bollinger Band in order to execute.
The profit objective is usually in the middle, while the stop loss points are above or below the upper and lower bands, respectively.
Bounce Strategy:
The Bollinger Band bounce strategy works best in inactive market circumstances, unlike the squeeze.
Trading the bounce strategy can be useful when the price slants upward or downward between the mid-moving average and the upper or lower band.
The bounce strategy is similar to a squeeze in the live market; one sells from the upper Bollinger Band and buys from the lower Bollinger Band.
However, given the high volatility and prolonged stop losses, higher profit objectives are the midpoints.
How to use Bollinger Bands?
Bollinger Bands can be utilized on charts with weekly, daily, or five-minute timescales. In addition, different trading styles can be suited by adjusting the parameters.
When the price of security swings towards the top band, it indicates that it is overbought. Traders typically attempt to sell when they feel security has become overbought.
When the price of security swings towards the lower band, it indicates that it is oversold. Traders typically seek stocks that are oversold.
On the other hand, Bollinger Bands aren’t ideal as a trading indicator. They don’t always send out accurate signals.
As a result, they work best when used in combination with other technical analysis indicators to produce more precise trading recommendations.
Here are some other technical analysis indicators to use with Bollinger Bands:
Moving averages (MA):
Moving averages are the most widely used trading strategy. Traders use these to determine the direction of a trend. A moving average depicts a security’s average price over a period of time.
Stochastic Indicator:
Another popular technical analysis tool is the stochastic indicator. These can be used to forecast trend reversals. The momentum of price fluctuations is measured by stochastics.
Average True Range:
ATR stands for average true range and is a technical indicator that gauges volatility. It was originally created to analyze commodities, but it may now be used to analyze indexes and equities as well.
Conclusion:
In the end, it is right to say that Bollinger Bands are a good technical analysis tool. For example, the bands are used to analyze volatility and trend strength.
These two factors are especially beneficial when swiftly opening and closing trades in a turbulent market.
Trend reversals may also be predicted using Bollinger Bands. These indicators are based on past data, so traders should keep that in mind.
As a result, the bands respond to price changes but do not predict future price changes. Therefore, risk management control should always be considered when trading utilizing Bollinger Bands.


